Introduction
With the dangers of Hurricanes/Tropical Storms, it is very important to know the trends and tracks of these potential threats to our community. We were able to use various layers to understand the patterns of these storms going back to the 1940s, throughout the entire state of NJ in order to be prepared for if and when they happen. If we can be prepared for them, we can keep people safe.
Data
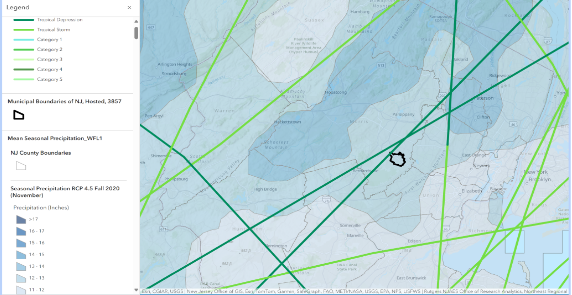
Hurricane tracks/tropical storms were determined by the historical hurricane tracks in the state of New Jersey. We were able to obtain the data from ArcGIS (Links to the providers are listed below). This information was provided by https://www.arcgis.com/home/item.html?id=d053e72aabfd4c5ab4139c3829c1e11c. We also looked at the average rainfall in each NJ town during the autumn months (Prime hurricane season). This information was also taken from the ArcGIS data set and could be found here: https://www.arcgis.com/home/item.html?id=0287558b6ff24f21af040e240eda1daf. The classifications for Hurricane Tracks are Tropical Depressions and Tropical Storms. The classifications for Average Rainfall are >17, 16-17,15-16, 14-15, etc. (All in inches).
Results
There have been 13 Hurricanes/Tropical Storms that have passed nearby Madison NJ since 1940. Unfortunately, there does not seem to be any correlation between these storms and the average rainfall.
According to what the map shows, Madison Township falls about directly in the middle of the average rainfall statistic for the state of New Jersey. On average for autumn months since the year 2020, Madison falls into the grouping of around 14-15 inches of rain per season.
Conclusion
Understanding the timing and locations of these hurricanes/tropical storms, we can prepare for them to minimize flooding, avoid disaster from wind or other dangerous situations involving civilization. Equity for this assignment is important because it allows anyone looking at this map to be aware of trends through hurricanes/tropical storms. It can also provide them with information on how to stay safe during uncertain times. Looking at the average rainfall for the state of New Jersey, we have learned that some places receive more rain than others throughout the state. We can use these charts and patterns to look at different changes in weather that could be affecting the environment. This could also affect the agricultural scene throughout the state and how things are produced and at what rate.
About the Data
The data set seen in this map has been broken down from the years 1940-present day. There can be 10 hurricanes/tropical storms seen in this data set from 1940-present day that have passed by Madison.
The average rainfall data set goes back to the year 2020. It has taken the average rainfall for the months in the autumn season. Each township varies based on its location of the state. Madison seems to fall somewhere in the middle of the average rainfall (In inches). More information on this GIS dataset can be found Here.
Find the Map Here
