Introduction
In the Madison, NJ and Morristown area, its important that we understand the severity of droughts in which can affect a number of factors like agriculture, water supply, aquatic ecology, wild life, and plant life.. Tap into morristown.. Specifically the drew forest in which the town prides them self in, contains lots of biodiversity. This map shows drought regions in New Jersey and Forest areas but we are focusing on Madison, NJ. It important to focus on the areas that display forest because of how it contributes to many habitats and species in Madison. The Madison Environmental Resource inventory ERI For this reason, shows only the drought region but it used as a way to provoke the thinking and exploring the vulnerability of droughts in areas like Morristown/ Madison area.
Data
Figure 1: Madison Drought area and Tree coverage (green is forest and pink is northeast indicating Morristown area, light pink northwest, yellow central, green southwest, and blue north.
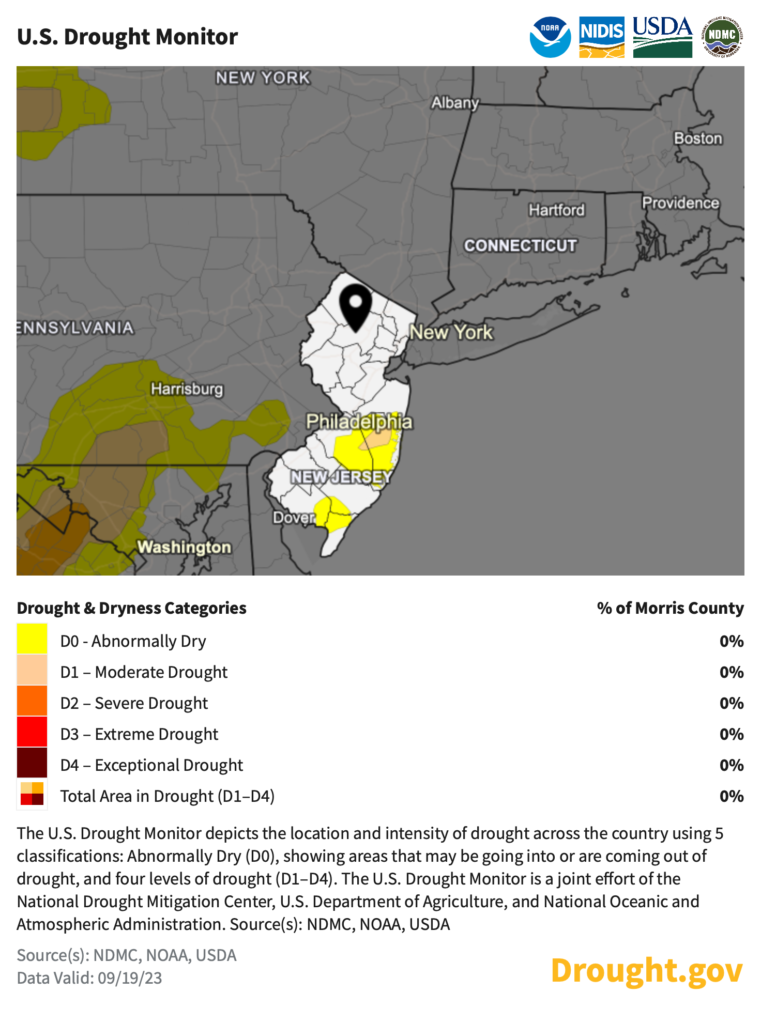
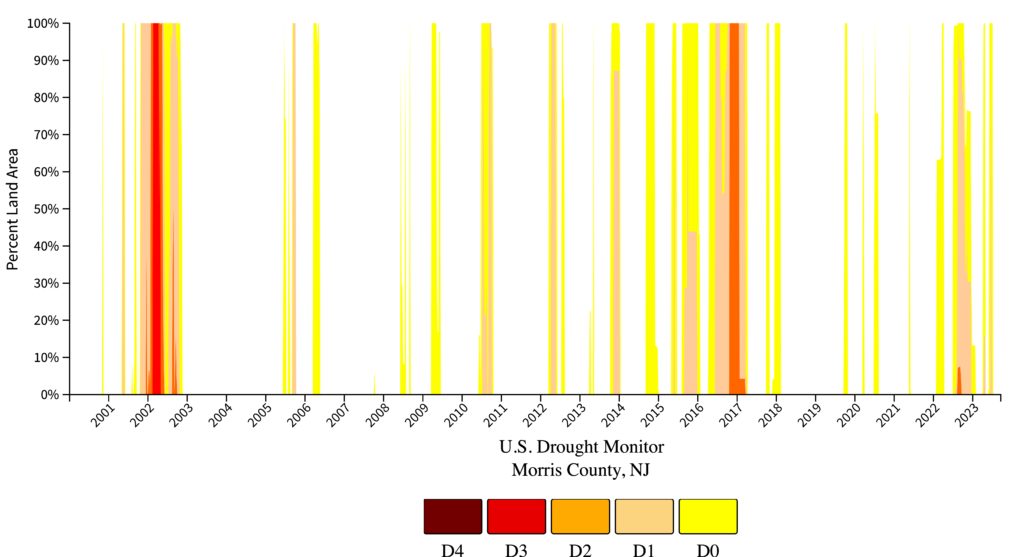
Figure 2: New Jersey Drought Monitor focusing on Morris County
Data
The New Jersey drought dataset layer of this map was created by the New Jersey Department of Environmental Protection. Drought information in New Jersey had been calculated using the data from National Integrated Drought Information System.
Results
The Yellow means abnormally dry and red means moderate to severe drought which we have had in 2023 within Morris County. Although our data layer from Madison ERI, doesn’t show it, we are exploring the affects on droughts in Morris/Madison Area. It is shown in figure 2 that within Morris county we will continue to experience impacts of droughts in which can damage agriculture and water supply within Madison community. As temperatures rise, people and animals will need more water to maintain normal functions of life. Which is important factor in maintaining the drew forest and its biodiversity. The amount of water available may be reduced as temperatures rise and as water usage increases. This can ultimately lead to more occurrences of drier conditions in Madison, NJ.
What are impacts of droughts in Madison NJ?
- Damage and loss of agriculture.
- More insects can lead to crop and tree losses
- Risk of wildfires due to dried crops, grasses, and dying trees.
- Decrease in water supply
- Streams and water levels were low.
- Low waters impacted the fish population.
Conclusion
In looking at the data layer Drought regions, we were able to identify due to our area being apart of the temperate broadleaf forest biome what areas were going to be of importance in pertain to droughts. It’s important to be discussing about droughts in order to understand the trend we see in terms of water, agriculture, and vegetation as we enter out of the drought seasons.
About the Data
The layer provided from NJDEP, shows drought regions for six areas based on regional similarities in water supply sources and rainfall patterns. Reveal areas susceptible to extreme heat that are affecting vulnerable populations. Use of Land cover data layer from New Jersey Environmental Protection in order to show areas that may be affected my drought and the ecosystem surrounding it. Data provided from NIDIS and Morris county 2015 drought risk assessment.
To download one-page summary slide on Drought regions of importance in Madison NJ, click here.
